Cancer Incidence and Environmental Pollutants
Creating a thriving and resilient community with machine-learning and data driven evidence.
Pollution Data Scatter Plot
Ozone Data Scatter Plot
The pollution and ozone datasets were broken down by year from 2001 to 2016.
The cancer data set comprised a single “recent trend” data point per
FIPS based on data from 2000 to 2014. The years 2015 and 2016 were removed
from the environmental data to create a cohesive dataset, then all three datasets were aggregated using
the pollution and ozone mean values by FIPS and year.
Model Dataset Table
| FIPS | Recent Trend | PM25 Max Pred | PM25 Med Pred | PM25 Mean Pred | O3 Max Pred | O3 Med Pred | O3 Mean Pred | PM25 Max Pred 2001 | PM25 Max Pred 2002 | PM25 Max Pred 2003 | PM25 Max Pred 2004 | PM25 Max Pred 2005 | PM25 Max Pred 2006 |
|---|
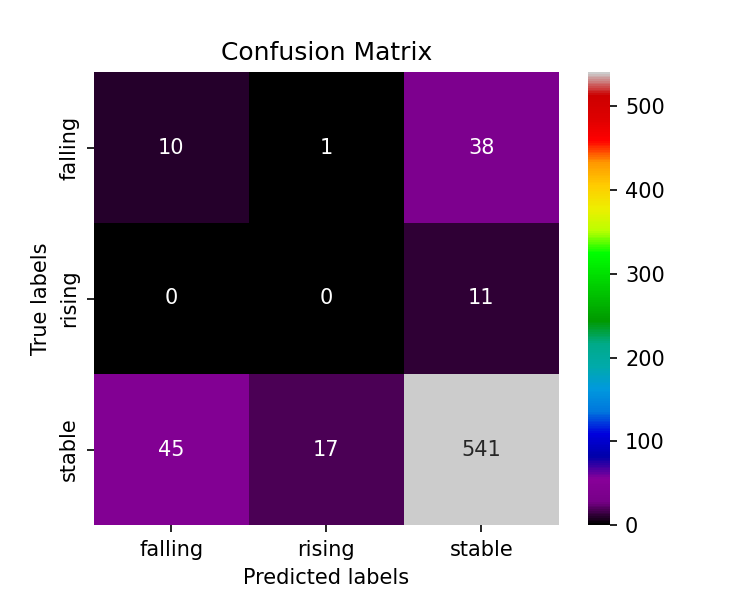
The confusion matrix generated using the SMOTE algorithm still favors the majority class, classifying around 90% of the stable class accurately, and only 20% of the falling class, and none of the rising.
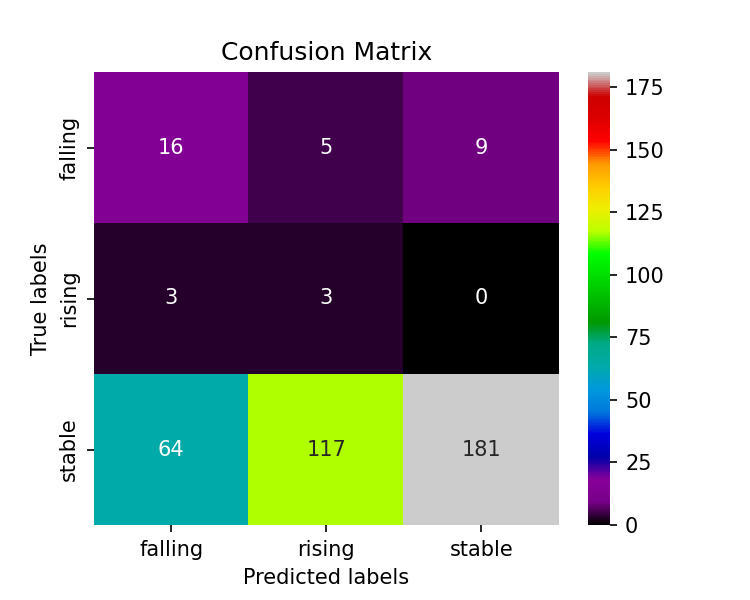
After applying the cluster centroid algorithm, the data points were undersampled to 37 data points for each class. This improved the overall balanced accuracy from 37% to 51%.
Oversampling
Confusion Matrix SMOTE Resampling
Undersampling
Confusion Matrix Cluster Centroid Resampling